

Introduction to the Tocal Dairy monthly reports
The purpose of this report is to demonstrate to industry the performance of a farm with a production system that is representative of a large percentage of the NSW dairy industry (average herd size ~300 cows, pasture based and year-round calving). It is compiled by the NSW DPI Dairy Business Advisory Unit in conjunction with the Tocal Dairy team.
This report presents DAILY and MONTHLY information on the farm’s performance using information that is readily available within most dairy businesses. By monitoring the performance of the business, it is possible to check that performance is on track to meet the farm’s goals, help identify challenges or opportunities and refine management strategies as needed.
These reports will be the focus of periodic podcasts featuring the dairy manager and others involved in the dairy and its business planning.
The one-page report has two components:
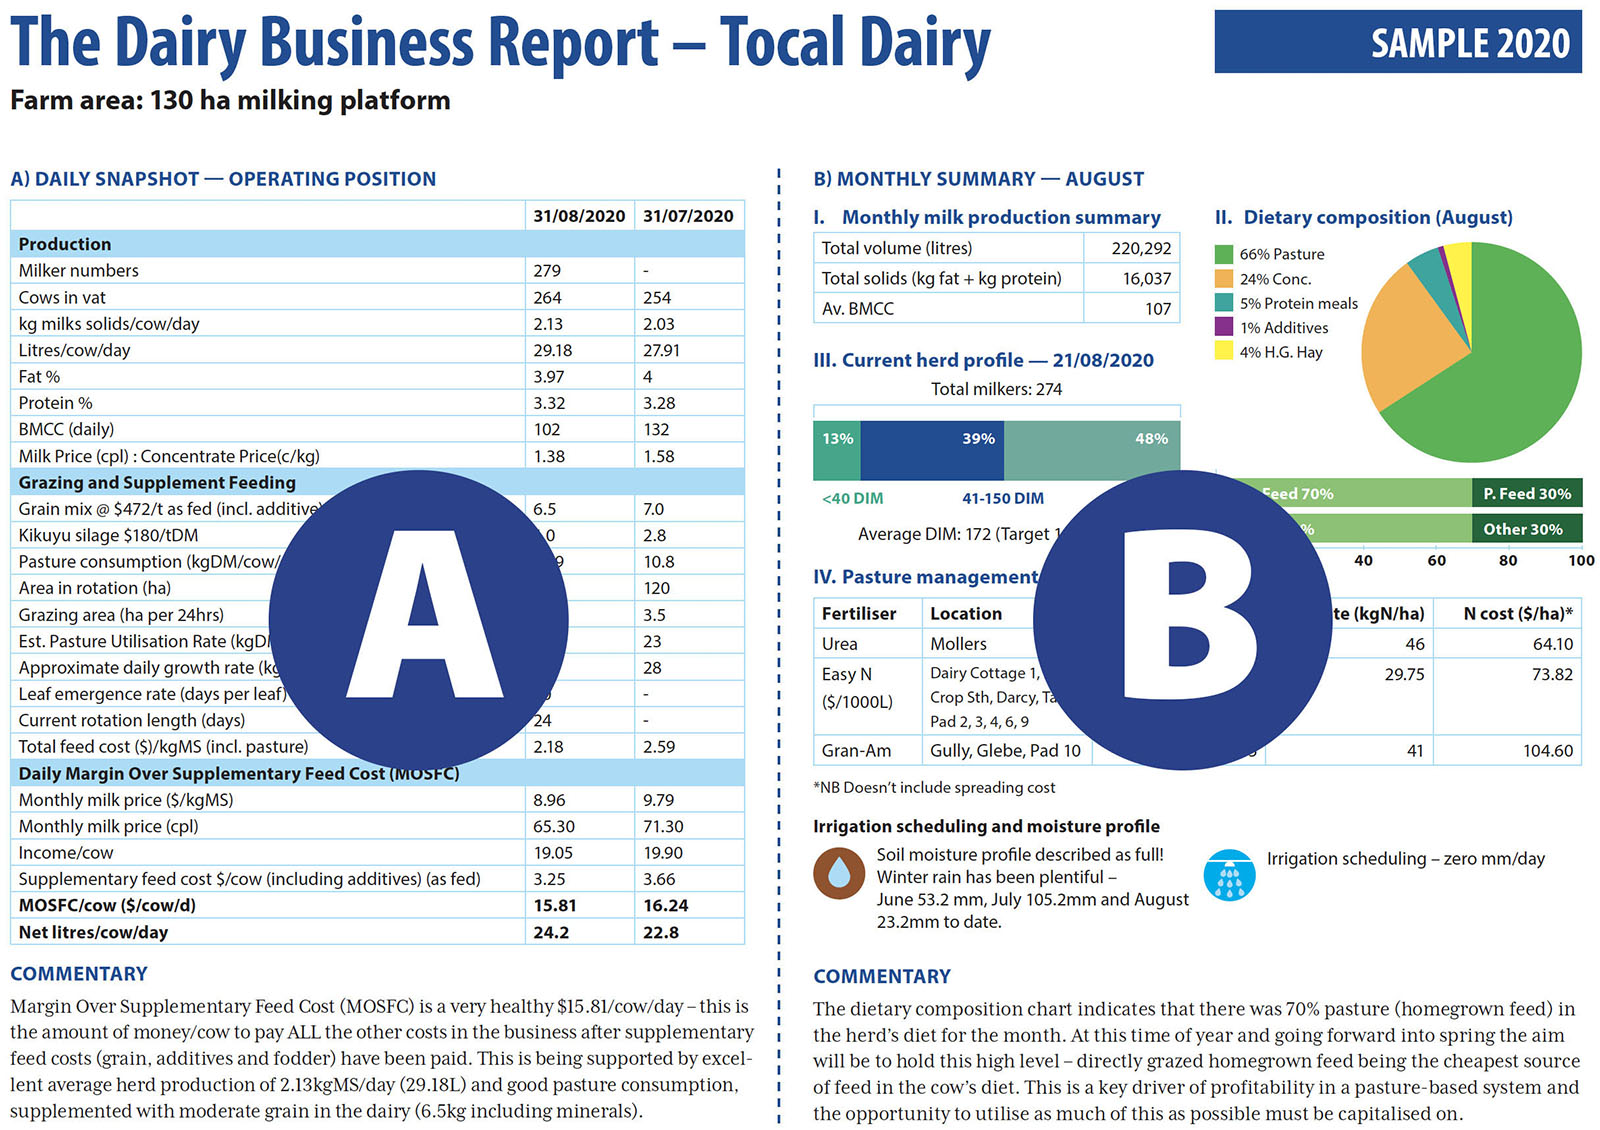
A. The DAILY Operating Position
The figures in this table are a snapshot of the farm’s performance on a particular day (nominally the last day of each month). With an understanding of the interaction between inputs, resources and the farm system, good daily marginal decisions can be made that ultimately drive the financial performance of the business.
It gives you an indication of many things including:
- Cow production on that day (kg milk solids/cow/day and litres/cow/day)
- What the milkers are being fed and the cost to feed a milker per day
- Milk price to concentrate price ratio
- Margin over supplementary feed cost (the $/cow/day left to pay ALL the other cash costs in the business that day, once supplementary feed has been paid)
- Net litres – the number of litres that are being produced per cow to cover ALL the other costs in the business based on the particular supplementary feed inputs and milk price relevant to the farm.
- Eat rate (Pasture consumption rate) – the estimated kgDM/ha/day being consumed by the milking herd over the whole milking platform area that is in the current rotation. This can be compared to the estimated pasture growth rate across the farm – is a surplus building in front of you or are you eating it quicker than the rate that it is currently growing at?
- The current month’s performance figures can be compared against that of the previous month.
B. The MONTHLY update
This summarises:
- The milking herd performance in terms of total milk production for the month
- Dietary composition – highlighting the proportion of home-grown feed, concentrates and other feeds in the diet
- Milking herd profile with reference to days in milk (DIM)
- Nitrogen fertiliser use and its cost
- Irrigation scheduling and moisture profile
- General commentary about on-farm activity for the month
Tocal newsletter
Want to find out about news, events, courses and publications?